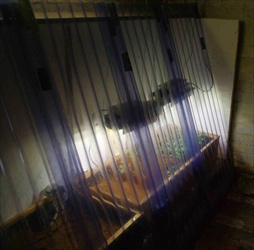
Propagation 2011 - LED grow lights
Results vs. Design
How does it perform?
Voltages
During the design I aimed to have 1.25 A to drive the LEDs and expected a 3.4 v across each LED. What I measured was a lower voltage drop - 3.12 v. This meant that rather than the 24.65v I anticipated, I only required 22.52v - i.e. I had to reduce the psu output voltage, rather than increase it. This also meant that I could increase the current a bit, to maximise the light output. By adding a 10 Ohm resistor in parallel with the 1 Ohm one, the current increased to 1.35A
Light output
The table below shows the expected light output at different LED junction Tj temperatures, the reduction in light as temperature increases, the increase in light output as current increases. The start point was a 130lm output. The first 4 rows show the cases I examined during design, the last row is what I achieved.
| Current | Tj | Tj reduction | output lm | Current gain | output lm | PPFD Chlor |
| 1.25 | 55 | 0.95 | 123.5 | 2.9 | 358 | 3.34 |
| 1.25 | 60 | 0.92 | 119.6 | 2.9 | 347 | 3.24 |
| 1.4 | 62 | 0.915 | 118.95 | 3.2 | 381 | 3.56 |
| 1.5 | 65 | 0.9 | 117 | 3.3 | 386 | 3.6 |
| 1.35 | 61 | 0.915 | 119.6 | 3.2 | 383 | 3.57 |
Temperatures
From the above table you can see that the Tj I obtained was 61 deg C. This is by interpolation from the various temperatures I measured and comparison with the expected values.
The measured temperatures can be seen in the table below. Blue cells are with the fan working, green are without the fan. With the fan results I had to modify the LED star heatsink Rsths and the actual heatsink Rhsa values to align with the temperatures measured. The main result is that the heatsink seems to achieve 2.4 deg C / W close to the 2 deg C / W requirement - success!! To check the benefit of the fan - I measured the temperatures again with the fan not running. The difference was significant - again I had to adjust the Rsths and Rhsa values to fit with the measured temps. Overall it confirms that the fan is vital, as well as achieving the 250% improvement suggested in the hest sink paper..
| Tj oC | Rjst oC/W | Tst oC | Rsths oC/W | Ths oC | Rhsa oC/W | Ta oC |
| 61.68 | 6 | 35.76 | 3.1 | 22.368 | 2.4 | 12 |
| 97.92 | 6 | 72 | 2.55 | 56 | 10 | 12.8 |
| 93.875 | 6 | 68.375 | 3.5 | 53.50 | 10 | 11 |
| 89.625 | 6 | 64.125 | 3.5 | 49.25 | 9 | 11 |
| 85.375 | 6 | 59.875 | 3.5 | 45.00 | 8 | 11 |
| 81.125 | 6 | 55.625 | 3.5 | 40.75 | 7 | 11 |
| 76.875 | 6 | 51.375 | 3.5 | 36.50 | 6 | 11 |
| 72.625 | 6 | 47.125 | 3.5 | 32.25 | 5 | 11 |
| 68.375 | 6 | 42.875 | 3.5 | 28.00 | 4 | 11 |
| 64.125 | 6 | 38.625 | 3.5 | 23.75 | 3 | 11 |
| 59.875 | 6 | 34.375 | 3.5 | 19.50 | 2 | 11 |
| 55.625 | 6 | 30.125 | 3.5 | 15.25 | 1 | 11 |


